

Using modeled data, astronomers have created a glimpse of the sky as it would appear in gravitational waves, the cosmic ripples in space-time created by orbiting objects. The image shows how space-based gravitational wave observatories, expected to be launched in the next decade, will improve our understanding of our galactic home.
See how gravitational waves from a modeled population of compact binary systems are combined into a synthetic map of the entire sky. Such systems contain white dwarfs, neutron stars, or black holes in narrow orbits. Similar maps using real data will be possible when space-based gravitational wave observatories start operating in the next decade.
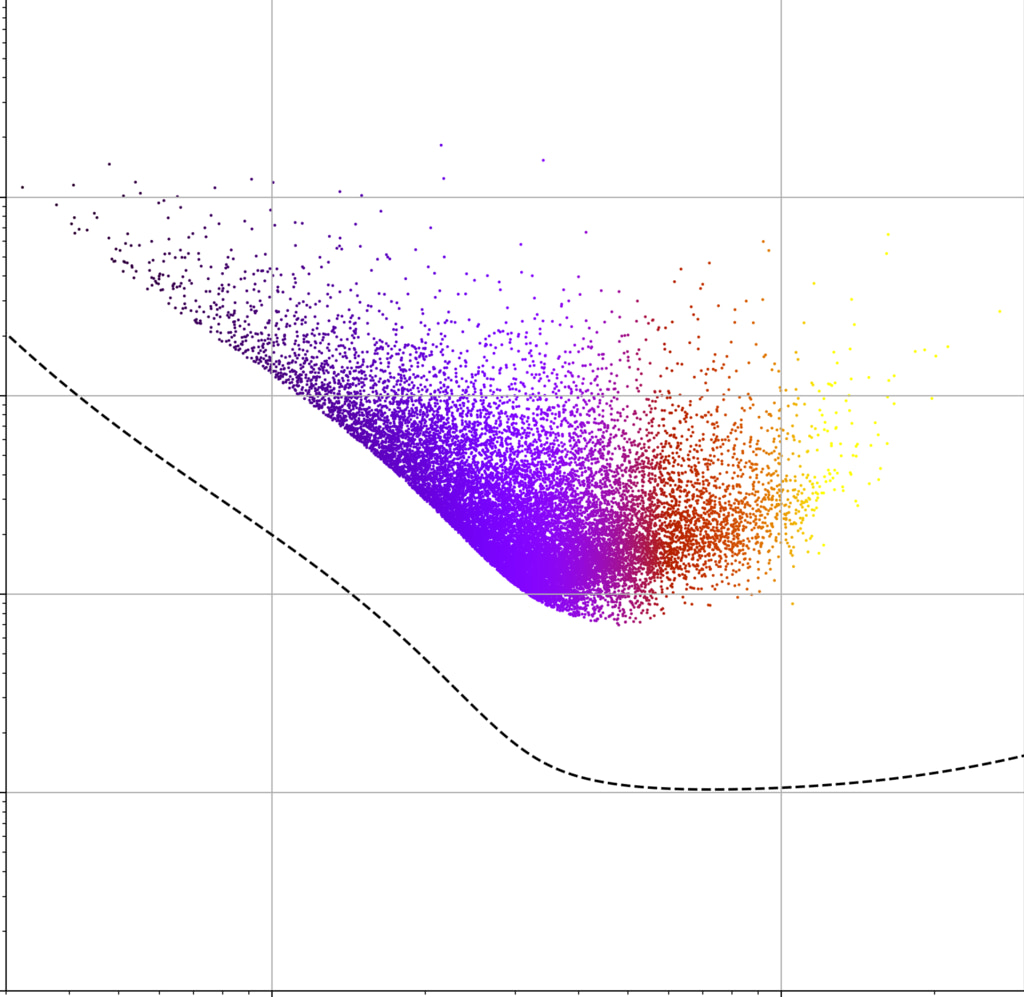
Brighter spots indicate sources with stronger signals, and lighter colors indicate sources with higher frequencies. Larger colored spots show sources whose positions are less well known. The inset shows the frequency and strength of the gravitational signal, as well as the sensitivity limit for LISA (Laser Interferometer Space Antenna), an observatory currently being designed by ESA (European Space Agency) in collaboration with NASA for launch in the 2030s.
Gravitational forces
Since 2015, ground-based observatories have detected about a hundred events, which are mergers of systems that combine stellar-mass black holes, neutron stars, or both. The signals usually last less than a minute, have relatively high frequencies, can appear anywhere in the sky, and their sources lie far beyond our galaxy.
“Binary systems also fill the Milky Way, and we expect many of them to contain compact objects like white dwarfs, neutron stars, and black holes in tight orbits,” said Cecilia Cirenti, a researcher at the University of Maryland and NASA’s Goddard Space Flight Center in Greenbelt.
According to her, scientists need a space observatory to detect such objects because their gravitational waves buzz at frequencies too low for ground-based detectors.
Credit: NASA Goddard Space Flight Center
The world of UCBs
Astronomers call these systems UCBs (ultra-compact binaries) and expect future observatories like LISA to detect tens of thousands of them. UCBs are generally difficult to spot – they are usually faint in visible light, and astronomers currently know of only a few with orbital periods shorter than an hour. The discovery of many new UCBs is one of the main goals of LISA.
Using data modeling the expected distribution and gravitational wave signals of these systems, the team developed a way to combine the data into a panoramic image of the galaxy’s UCBs. An article published in The Astronomical Journal describes this technique.
“Our image is directly analogous to an all-sky view of the sky in a particular type of light, such as visible, infrared, or X-rays,” said Goddard astrophysicist Ira Thorpe.
She emphasized that the peculiarity of gravitational waves is that we will be able to observe the Universe in a completely different way. And this modeling really captures them.


